 Chrome
 Edge
Edge Firefox
Want to update the data for this profile? Claim it!

Location & Contact
Address
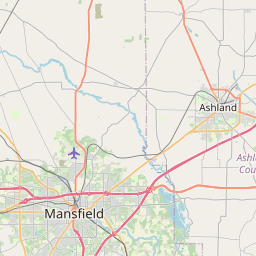
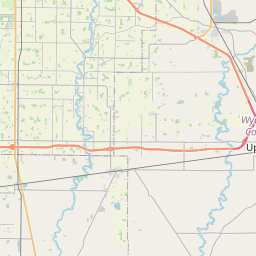
1760 University Drive
Mansfield, OH 44906
United States
Mansfield, OH 44906
United States
Contact
Phone: 419-292-6446
Admissions
Acceptance Rate
2,455
Applied
2,451
Accepted
739
Enrolled

Female Admissions
1,432
Females Applied
1,430
Females Accepted
100%

Male Admissions
1,023
Males Applied
1,021
Males Accepted
100%
Applying
60
Application Fee
| Admission Requirements | |
|---|---|
| Required |
Transcript of high school record |
Application Deadlines
| Type | Application Closing | Notification Date | Rolling Admissions |
|---|---|---|---|
| Fall freshmen | July 15th | November 1st | No |
| Out of state Fall freshmen | July 14th | Not reported | No |
| Other early decision plan | Not reported | Not reported | No |
| Transfer | July 15th | Not reported | Yes |
Test Scores Accepted
| Test | Avg. Score | 25th %
 | 75th %
| |
|---|---|---|---|---|
| SAT Critical Reading | 530 | 510 | 620 | |
| SAT Math | 548 | 460 | 610 | |
| ACT Composite | 22 | 20 | 26 |
Tuition & Fees

Tuition
8,944
In-state
33,181
Out-of-state
8,944
In-district

Fees
255
Full-time student fees
10,408
Room & board
8,532
Room only
Financial Aid
11,514
Avg. Financial Aid Package
12,067
Avg. Freshman Financial Aid Package
3,747
Avg. Loan Aid
2,547
Avg. Grant Aid
8,372
Avg. Scholarship and/or Grant Aid awarded
Percentage of students with need who receive financial aid
68%
Avg. Percentage of Financial Need Met
13%
Percentage of Students Who Had Their Need Fully Met
Student Body
739
Total Undergrad students
1%
Out-of-state students
Race/Ethnicity
| Hispanic/Latino | 6.1% |
|---|---|
| Black or African American | 5.95% |
| White or Caucasian | 76.52% |
| Asian | 4.27% |
| Native Hawaiian or Pacific Islander | 0.15% |
| Two or more races | 4.27% |
| Other | 2.74% |
Gender
Male (46.01%)
Female (53.99%)
Campus Life
Housing
| Type | |
|---|---|
| College-owned housing | Yes |
| Housing requirements | None |
| Housing options |
Co-ed housing Disabled housing Freshman car parking |
| % of undergrad students who live in college housing | 26% |
Student Activities
Student-run campus newspaper

Drama/theatre group
Student-run radio station
Student-run television station
Marching band
Choral groups
Campus events:
Welcome Week Welcome Party, Outdoor Movie Night (Welcome Week) and Soul Food Dinner
Welcome Week Welcome Party, Outdoor Movie Night (Welcome Week) and Soul Food Dinner
Student Services
Legal services
Health clinic
Personal/psychological counseling
Women's center
International students advisor
Student Organizations
Greek fraternities
Greek sororities
Local fraternities
Local sororities
More
Most popular organizations:
No More, We Matter, Student Leadership Council, NAMI on Campus and CRU
No More, We Matter, Student Leadership Council, NAMI on Campus and CRU
Campus Security & Safety
24-hour emergency telephone/alarm services
24-hour patrols by trained officers
Student patrols
Late-night transport/escort services
Electronically-operated dormitory entrances
Athletics
Men's Sports
| Sport | Intramural | Intercollegiate | Scholarship |
|---|---|---|---|
| Basketball | | No | No |
| Cheerleading | | No | No |
| Football | | No | No |
| Soccer | | No | No |
| Tennis | | No | No |
| Ultimate Frisbee | | No | No |
| Volleyball | | No | No |
Women's Sports
| Sport | Intramural | Intercollegiate | Scholarship |
|---|---|---|---|
| Basketball | | No | No |
| Cheerleading | | No | No |
| Football | | No | No |
| Soccer | | No | No |
| Tennis | | No | No |
| Ultimate Frisbee | | No | No |
| Volleyball | | No | No |
Faculty
74
Total Faculty
16:1
Student-Faculty Ratio
Full-time - 31
Part-time - 43
Male - 28
Female - 46
The Ohio State University at Mansfield