 Chrome
 Edge
Edge Firefox


Want to update the data for this profile? Claim it!

Location & Contact
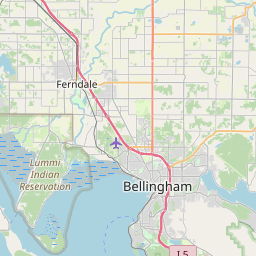
Address
516 High Street
Bellingham, WA 98225
United States
Bellingham, WA 98225
United States
Admissions
Acceptance Rate
14,209
Applied
12,978
Accepted
13,689
Enrolled

Female Admissions
8,623
Females Applied
7,939
Females Accepted
92%

Male Admissions
5,586
Males Applied
5,039
Males Accepted
90%
Applying
70
Application Fee
3.5
Avg. high school GPA for freshman
| Admission Requirements | |
|---|---|
| Required |
Transcript of high school record Essay A minimum high school GPA of 2 |
Application Deadlines
| Type | Application Closing | Notification Date | Rolling Admissions |
|---|---|---|---|
| Fall freshmen | January 31st | September 15th | No |
| Other early decision plan | November 1st | December 31st | No |
| Transfer | March 1st | Not reported | Yes |
Test Scores Accepted
| Test | Avg. Score | 25th %
 | 75th %
| |
|---|---|---|---|---|
| SAT Critical Reading | 632 | 570 | 690 | |
| SAT Math | 589 | 530 | 660 | |
| ACT Composite | 26 | 23 | 29 |
Tuition & Fees

Tuition
7,488
In-state
26,613
Out-of-state
7,488
In-district

Fees
2,079
Full-time student fees
15,747
Room & board
8,474
Room only

Other Payment Considerations
| Guaranteed tuition plan offered | No |
|---|---|
| Tuition pre-payment plan | No |
| Tuition payment plans offered | Yes |
| Student groups that qualify for full or partial waiver of tuition |
Employees |
Financial Aid
22,010
Avg. Financial Aid Package
22,150
Avg. Freshman Financial Aid Package
9,368
Avg. International Student Financial Aid Package
4,264
Avg. Loan Aid
2,167
Avg. Grant Aid
11,105
Avg. Scholarship and/or Grant Aid awarded
Percentage of students with need who receive financial aid
76%
Avg. Percentage of Financial Need Met
16%
Percentage of Students Who Had Their Need Fully Met
Student Body
13,689
Total Undergrad students
1%
International Students
13%
Out-of-state students
Race/Ethnicity
| Hispanic/Latino | 10.99% |
|---|---|
| Black or African American | 1.98% |
| White or Caucasian | 69.39% |
| American Indian or Alaska Native | 0.36% |
| Asian | 5.8% |
| Native Hawaiian or Pacific Islander | 0.21% |
| Two or more races | 9.11% |
| Other | 1.36% |
Gender
Male (42.49%)
Female (57.51%)
Campus Life
Housing
| Type | |
|---|---|
| College-owned housing | Yes |
| Housing requirements | None |
| Housing options |
Co-ed housing Disabled housing Freshman car parking |
| % of undergrad students who live in college housing | 30% |
Student Activities
Student-run campus newspaper

Drama/theatre group
Student-run radio station
Choral groups
Campus events:
Back2Bellingham, Fall Family Weekend and Lawnstock
Back2Bellingham, Fall Family Weekend and Lawnstock
Student Services
Legal services
Health clinic
Personal/psychological counseling
Women's center
International students advisor
Student Organizations
Greek fraternities
Greek sororities
Local fraternities
Local sororities
Most popular organizations:
Intramurals, Residence Hall Association, Associated Students, Outdoor Center and Ethnic Student Center
Intramurals, Residence Hall Association, Associated Students, Outdoor Center and Ethnic Student Center
Campus Security & Safety
24-hour emergency telephone/alarm services
24-hour patrols by trained officers
Student patrols
Late-night transport/escort services
Electronically-operated dormitory entrances
Athletics
Men's Sports
| Sport | Intramural | Intercollegiate | Scholarship |
|---|---|---|---|
| Badminton | | No | No |
| Baseball | No | | No |
| Basketball | | Division 2 | |
| Crew | No | | No |
| Cross-country Running | | Division 2 | |
| Equestrian Sports | No | | No |
| Golf | | Division 2 | |
| Ice Hockey | No | | No |
| Indoor Track | No | No | No |
| Lacrosse | No | | No |
| Rock Climbing | No | | No |
| Rowing | No | | No |
| Rugby | No | | No |
| Sailing | No | | No |
| Skiing (downhill) | No | | No |
| Soccer | | Division 2 | |
| Softball | | No | No |
| Swimming And Diving | No | | No |
| Tennis | | | No |
| Track And Field | No | Division 2 | |
| Ultimate Frisbee | No | | No |
| Volleyball | | | No |
| Water Polo | No | | No |
| Wrestling | No | | No |
Women's Sports
| Sport | Intramural | Intercollegiate | Scholarship |
|---|---|---|---|
| Badminton | | No | No |
| Baseball | No | | No |
| Basketball | | Division 2 | |
| Crew | No | Division 2 | |
| Cross-country Running | | Division 2 | |
| Equestrian Sports | No | | No |
| Golf | | Division 2 | |
| Ice Hockey | No | No | No |
| Indoor Track | No | No | No |
| Lacrosse | No | | No |
| Rock Climbing | No | | No |
| Rowing | | Division 2 | No |
| Rugby | No | | No |
| Sailing | No | | No |
| Skiing (downhill) | No | | No |
| Soccer | | Division 2 | |
| Softball | | Division 2 | |
| Swimming And Diving | No | | No |
| Tennis | | | No |
| Track And Field | No | Division 2 | |
| Ultimate Frisbee | No | | No |
| Volleyball | | Division 2 | |
| Water Polo | No | | No |
| Wrestling | No | | No |
Faculty
1,007
Total Faculty
17:1
Student-Faculty Ratio
Full-time - 686
Part-time - 321
Male - 462
Female - 513
Western Washington University